
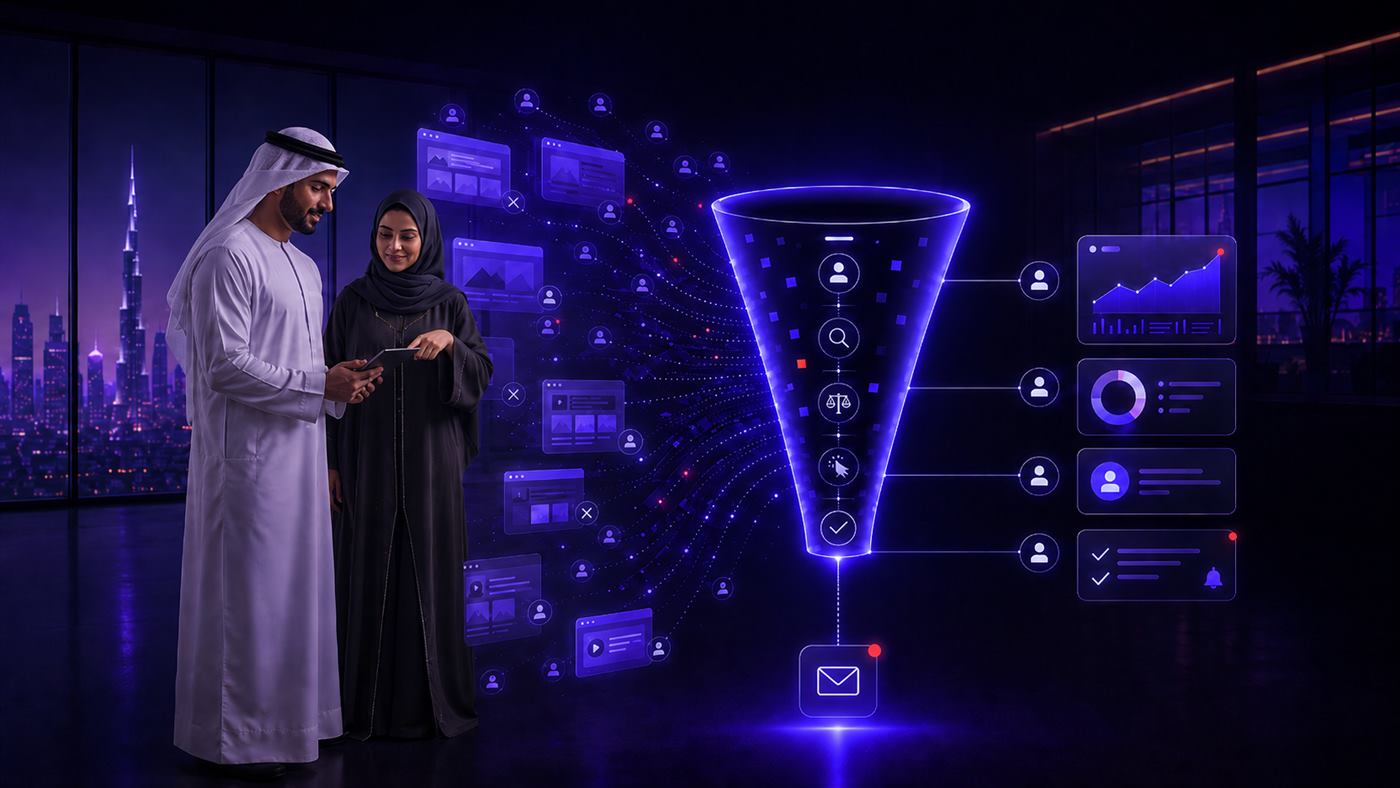
Why Don't Your Website Visits Turn Into Requests?
A practical study showing where opportunities are lost between a website visit and a submitted request, and how the page, follow-up, and data can be connected in one measurable journey.
Executive Summary
A visit that does not become a request is not just an analytics number. It may represent paid acquisition cost, incomplete interest, and an opportunity that moved to a faster or clearer competitor.
For many businesses, the problem is not traffic volume alone. It appears after the visitor reaches the page: did they understand the offer, find enough trust, know the next step, complete the form, enter a follow-up system, and receive a timely response?
The evidence indicates that page speed, visual complexity, form friction, trust, and response speed influence user behavior. Conversion therefore cannot be improved through appearance alone. The website journey must connect to request capture, follow-up, and measurement from the first click to the meeting or sale.
The business should identify exactly where the opportunity is lost, traffic quality, page clarity, request flow, communication channel, response speed, follow-up, or missing data, and prioritize changes using a baseline and measured evidence.
How This Research Was Prepared
This research draws on official, professional, and peer-reviewed sources covering user experience, website speed, visual complexity, digital forms, online trust, customer experience, and SME digitalization. It does not assume a single conversion rate that applies to every business, since results vary by industry, traffic source, price, request type, device, and market. Some regional studies focus on ecommerce; they are used here to understand trust and website quality, not to transfer their figures directly to every B2B or service business.
A Quick Check for Conversion Leakage
High traffic, few requests: track the visitor-to-request rate. If traffic is arriving but few visitors act, the source may not match the page, the offer may be unclear, or the call to action may be weak.
Visitors leave early: review engagement, scroll depth, and page exits. Slow loading, a weak mobile experience, or unclear value can cause visitors to leave before they understand the offer.
Forms are started but not completed: check the completion rate and the point where users stop. Every unnecessary field adds effort.
WhatsApp requests arrive without structure: track first-response time and requests that receive no follow-up. Record each request in one system with an owner, a next step, and a follow-up date.
Requests do not become meetings: review the share of qualified requests that become meetings or bookings. Use clear opportunity stages, simple qualification rules, and reminders.
Management cannot see where the problem begins: compare outcomes by source, campaign, and page, and connect analytics, requests, meetings, and sales in one dashboard.
The Problem in One Sentence
A website visit does not become a request when the customer cannot find a clear, safe, and easy path from interest to contact, or when the business cannot capture and follow up that interest quickly and systematically after the first contact.
In services and complex purchases, the decision rarely happens in one moment. The customer may request a booking, consultation, quotation, visit, or the start of a longer relationship. This requires clarity, trust, timely response, and follow-up that does not depend on memory alone.
Why Traffic Alone Is Not Enough
Visits indicate attention or curiosity. They do not prove that the visitor belongs to the right audience, understood the offer, found an easy contact path, or received consistent follow-up.
A common mistake is to treat weak request volume as an advertising problem only. Sometimes the ad is working, but the post-click journey is incomplete: a slow page, generic message, weak CTA, long form, or crowded inbox that is disconnected from follow-up.
Following the Journey from Visit to Sale
Instead of treating conversion as one number, divide the journey into transitions. Each transition reveals a different type of problem.
Qualified visit: did the right person reach the page? Compare traffic sources, campaigns, landing pages, and devices.
Understanding the offer: did the visitor stay long enough to understand what the business offers and why it is credible?
Starting an action: did the visitor click the contact button or begin the form?
Completing the request: did the visitor submit their details successfully? Track completion and identify the fields where people leave.
First response: did the customer receive a clear response at the right time? Measure median first-response time.
Qualification and meeting: did suitable requests become serious conversations, meetings, or bookings?
Decision or sale: did qualified opportunities become contracts or purchases?
A page may perform well while follow-up is weak, or follow-up may be strong while traffic is poorly qualified. Breaking the journey into stages prevents the business from fixing the wrong problem.
Where Requests Are Lost in the Customer Journey
Landing on the page: if the page is slow or the mobile experience is weak, visitors may leave before they understand the offer or see anything that builds trust.
Understanding the service: generic or highly technical language does not quickly answer the customer's main questions, what do you offer, who is it for, what result can I expect.
Taking the next step: an unclear button, too many options, or a form that asks for detailed information too early can stop the customer before the request is completed.
After submission: without clear confirmation, a timely response, or a named owner, the customer may lose interest or contact a competitor.
Managing the opportunity: when follow-up depends on WhatsApp, spreadsheets, and memory, opportunities are lost and the reason for stalled deals remains unclear.
What the Evidence Shows
Page speed changes behavior. Google analyzed 11 million mobile landing pages across 213 countries and reported that moving from a one-second to a ten-second load time was associated with a 123% increase in the probability of a mobile visitor bouncing. Increasing page elements from 400 to 6,000 was associated with a 95% reduction in the probability of conversion [1]. Peer-reviewed web-search research also found that, when identical result pages were served at different speeds, users were more likely to click on the faster page [8].
Visual complexity consumes attention. A CHI study found that higher visual complexity had a significant negative effect on website search efficiency and information recall [7]. A page needs to do more than look attractive; it should help users find the answer and next step quickly.
Pages should be measured by outcomes, not appearance. The Unbounce benchmark analyzed more than 57 million conversions and 41,000 landing pages, reporting a 6.6% median conversion rate across industries, with 83% of sample visits coming from mobile and desktop conversion performing 8% better [2]. This figure should not become a universal target; the meaningful comparison is against an internal baseline.
Long forms increase friction. Nielsen Norman Group proposes the EAS framework, eliminate what is unnecessary, automate what can be automated, and simplify what remains [3]. Baymard reports an average of 11.3 checkout fields in 2024 and notes that 17% of users abandoned because the process was too complicated [4].
Trust and website quality influence intention. A UAE ecommerce study found that website quality and perceived service quality positively affected trust and purchase intention, with trust acting as a mediator [9]. A study of 414 experienced online buyers in Morocco found that reputation and trust influenced attitude and purchase intention [10]. A Jordanian study found that website cues influenced satisfaction and that satisfaction was associated with purchase intention [11].
Response expectations are rising. Zendesk CX Trends 2026 reports that 74% of consumers expect 24/7 service because of AI, 88% expect faster responses than one year earlier, and 74% are frustrated when they have to repeat their story to multiple agents [5].
Digital tools matter when integrated into operations. The 2026 OECD D4SME Survey covers more than 2,000 SMEs across 12 OECD countries and reports continued adoption of off-the-shelf AI tools, while strategic and secure integration into business operations remains uneven [6].
The Conversion Gap Model
Ensdim proposes viewing conversion as five connected layers. Reaching the first layer does not mean the others work.
Visibility: is the right customer reaching the page? Align the traffic source, message, and landing page.
Understanding: does the customer understand the service, expected outcome, and reason to trust the business?
Action: does the customer know the next step and complete it easily?
Follow-up: is the request recorded, answered, and followed without relying on memory?
Decision: can management see where opportunities stop and why?
Practical Examples
Medical center: the center pays for booking campaigns, but most requests arrive through WhatsApp with no clear view of who booked or still needs follow-up. The main leakage point may be after contact, not in advertising alone.
Real estate company: a visitor begins a sales conversation, but without a record of interest, status, and next follow-up date, the opportunity stays in a salesperson's memory instead of becoming a company asset.
Training center: visits arrive from ads or search, but registration is not completed because the form asks too many questions or people who started and stopped receive no follow-up.
Ecommerce or product business: a visitor adds a product to the cart or asks a question but does not complete the purchase because the page is slow or the inquiry receives no response.
Business Impact
Acquisition cost does not become a trackable opportunity.
Sales and support teams spend time on unstructured messages.
Opportunities are lost because of delayed response or no clear next step.
Management cannot distinguish a traffic problem from a page, response, or closing problem.
Scaling becomes harder because operations depend on people rather than a system.
Marketing decisions become inaccurate when visits are not connected to request quality and outcome.
A Connected Conversion and Follow-up Framework
Conversion review: review the page, message, mobile speed, call to action, and request form to identify where leakage begins.
Customer journey improvement: simplify the path from the first visit to the submitted request.
Customer-management setup: record every request with its source, status, owner, and next step.
Follow-up automation: use reminders, follow-up messages, and team alerts based on the opportunity stage.
Management dashboard: connect visits, requests, sources, meetings, and opportunity stages.
Practical AI support: use AI to summarize conversations, organize requests, and highlight cases that need attention once the workflow and data are clear.
A Practical 30-Day Implementation Plan
Week 1, measure and diagnose: review the page, message, call to action, mobile speed, and current data to build a prioritized list of issues.
Week 2, reduce friction: simplify the form, strengthen trust messages, and organize contact channels.
Week 3, organize follow-up: create a record for every request, define opportunity stages, and assign ownership.
Week 4, create visibility and improve: build an initial dashboard and review movement from the visit to the meeting or sale.
The 30-day goal is not to guarantee one improvement percentage. It is to create the first measurement cycle, reveal the largest leakage point, and support focused testing.
How Success Should Be Measured
Success should not be measured by request volume alone. Use a connected set of measures: visitor-to-action rate, form completion rate, visitor-to-request rate, first-response time, unanswered-request rate, qualified-request-to-meeting rate, and meeting-to-sale rate. Compare every change with the previous baseline, and break results down by source, campaign, page, device, and request type, because an overall average can hide the real leakage point.
What This Means for Businesses in the Gulf and Egypt
This analysis is especially relevant to businesses that rely on WhatsApp, manual follow-up, and disconnected files after a request arrives. These tools may work at low volume, but become more vulnerable to leakage as customer volume and team size grow. Global benchmarks should not be copied directly into a local market; the journey should be adapted to language, customer expectations, response norms, privacy, sector rules, and compliance.
Executive Conclusion
The conclusion is not that every company needs a new website. In many cases, the business needs a clearer path between the visit and the request, and a system that prevents the customer from being lost after the first contact.
When ads or organic traffic create attention that is not reflected in requests, meetings, or sales, the problem may be distributed across traffic quality, page clarity, form friction, response speed, and follow-up consistency. Good diagnosis begins by separating and measuring those stages.
References
[1] Think with Google, Find out how you stack up to new industry benchmarks for mobile page speed, 2018.
[2] Unbounce, Conversion Benchmark Report, 2024.
[3] Nielsen Norman Group, Less Effort, More Completion: The EAS Framework for Simplifying Forms, 2025.
[4] Baymard Institute, Checkout Optimization: 5 Ways to Minimize Form Fields in Checkout, 2024.
[5] Zendesk, CX Trends 2026, 2026.
[6] OECD, Empowering SMEs in the Age of AI: The 2026 OECD D4SME Survey, 2026.
[7] Baughan, August, Yamashita & Reinecke, Keep it Simple: How Visual Complexity and Preferences Impact Search Efficiency on Websites, CHI 2020.
[8] Arapakis, Bai & Cambazoglu, Impact of Response Latency on User Behavior in Web Search, SIGIR 2014.
[9] Hanaysha, Ramadan & Alhyasat, Exploring the impact of customer reviews, website quality, perceived service quality, and product assortment on online purchase intention, 2025.
[10] Jadil, Rana & Dwivedi, Understanding the drivers of online trust and intention to buy on a website, 2022.
[11] Albarq, Effect of Web atmospherics and satisfaction on purchase behavior, Future Business Journal, 2021.